..
Key Takeaways:
• Blade vibration is driven by the doctor set-up and Yankee coating properties
• Many upstream factors influence the Yankee coating properties and affect the risk of vibration
• Vibration monitoring hardware is readily available – use an off-the-shelf product, not a custom solution
• Day-to-day management of vibration relies on blade changes and Yankee coating add-on rates.
• Low vibration is not good enough in the long term – increasing blade or chemical consumption may indicate an increasing chatter risk, even while average vibration levels remain steady.
By Dr. James Litchwark, Global Solutions Team Engineer – Tissue, BTG
Introduction
Blade vibration is well known as the underlying process behind “chatter marks”, which in severe cases cause damage to the Yankee surface and require expensive regrinding to repair. Awareness of this problem has been rapidly growing in the industry, and it is now common to install sensors on the creping doctor to measure vibration during operation. Blade vibration measurement shares some similarities with conventional condition monitoring techniques, but there are also differences, especially when it comes to identifying the appropriate corrective actions required to solve the problem. This paper outlines the physics behind creping blade vibration, the basic measurements used to describe it, and some analysis methods that can be used to interpret the basic measurements and manage vibration with short- and long-term strategies.
Creping Blade Vibration – The physics of what’s happening
Vibration is driven by “stick-slip” friction between the blade and the Yankee, and by the delamination and buckling mechanism that produces crepe in the sheet. As the blade tip slides over the Yankee surface, it briefly sticks in place, bending slightly and increasing the strain in the blade. As the Yankee surface continues to move, the strain increases until it exceeds the static force holding the blade to the Yankee surface. The coating layer fractures for a certain distance ahead of the blade [1], and the blade slips across the Yankee surface, peeling off the sheet and slicing off some of the weakened Yankee coating as it goes. This relieves the strain in the blade. As the blade reaches the end of the weakened section of coating, it sticks again, and the cycle repeats. The frequency of the cycle is determined by the mechanical properties of the Yankee coating and sheet, the mechanical properties of the blade substrate (blade stiffness), and the pressure applied at the blade tip (linear load).
The vibrations at the blade tip cause the blade to bounce in the Yankee coating, creating an uneven surface as illustrated in Figure 1. When the vibration is severe, the bouncing blade cuts right through the Yankee coating and contacts the metallic Yankee surface. This can cause damage to the Yankee [2], leaving chatter marks in the surface (Figure 2) which often require a costly grind to remove [3]. Even in less severe cases, the uneven coating layer makes it difficult to control adhesion between the sheet and the Yankee, leading to picking holes or sheet breaks. Creping blade vibration can develop extremely quickly under certain conditions, and it is not unheard of for the Yankee to suffer damage within a few days of the first indication of rising vibration. It is therefore essential to monitor vibration in real time and take swift action to correct it. It should be noted that some level of vibration is always present, so the objective of vibration monitoring is to control and minimise the vibration, not to eliminate it completely.
 Figure 1 – Blade cutting through the Yankee coating – top: no vibration, bottom: severe vibration
 Figure 2 – Yankee surface with chatter marks
Any process changes that affect the mechanical properties of the Yankee coating may increase the risk of vibration and chatter. Since creping occurs at the end of the tissue making process, there are many upstream factors that can influence the Yankee coating and thus the forces experienced by the blade [4, 5]. Some of the most common issues that lead to a high vibration risk are:
• Yankee coating settings – The Yankee coating provides a protective layer between the blade and the Yankee. More coating = more protection.
• Furnish quality – Mechanical pulps or recycled fibres tend to contain high levels of fines which contaminate the Yankee coating, making it hard and rough
• Wet-end chemistry control – Variations in wet-end chemistry are carried forward with the sheet and impact the Yankee coating. Stock pH and wet-strength resin addition rates are especially important.
• Doctor condition and settings – As with all machinery, the creping doctor needs careful set-up and regular maintenance. Follow the manufacturers recommendations to ensure the doctor is in good condition.
The factors above all impact the long-term, baseline risk of vibration, but thankfully they tend to remain quite stable in the short term.
In contrast, one of the major factors impacting vibration in the short term on a tissue machine is the cycle of creping blade changes. Vibration generally starts low with a new blade and increases over the blade life, as shown in Figure 3 below. This occurs because a new, sharp blade cuts cleanly into the Yankee coating and can remove many of the bumps and irregular features left by a previous vibrating blade. As the blade becomes worn, its ability to cut into the coating is reduced and it rises in the coating layer. This allows the coating layer to thicken and bumps begin to reappear with a corresponding increase in vibration. Problems are therefore always more evident when the blade is worn.
 Figure 3 – RMS vibration trend showing typical increase in vibration over each blade life (BTG VigilancePRO™)
Measuring vibration
Blade vibration is typically measured using integrated electronic piezoelectric (IEPE) accelerometers mounted on the blade holder, and a signal processing device that converts the raw signal into a digital output that can be viewed on a computer. The fundamental measurements recorded are amplitude and frequency. Complete systems designed specifically for measuring doctor blade vibration are available from several suppliers. These systems all use similar hardware, so the key differences are in the way the data is output and displayed in the software interface, and in the data storage capacity. Most vibration systems have the ability to store historical data for a period of weeks or months, allowing the user to look back in time to previous events. This is very valuable for understanding recurring problems and carrying out root cause analysis. As data storage is a relatively low-cost component of a vibration system, there is effectively no limit to the length of history that can be saved. Users should look for a system that continuously stores both band average trends and spectrum data (explained in more detail below).
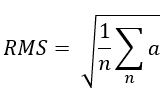
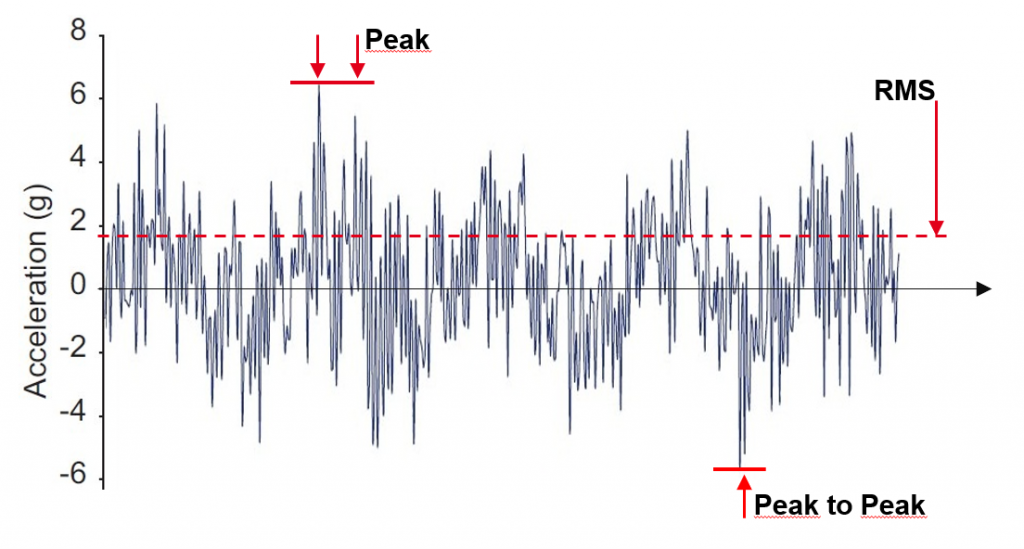
Amplitude is the size of the vibration and can be measured in terms of displacement, velocity, or acceleration. Acceleration is the preferred measure for doctor blades as it gives a better representation of the force involved in high-frequency signals. Acceleration is measured in units of ms-2 (metres per second per second) or g (gravities – 1.0 g = 9.81 ms-2). Since raw vibration signals are often complex, amplitude is represented using both the peak amplitude and the root-mean-square (RMS) average. These are illustrated with an example in Figure 4. Peak amplitude is the maximum acceleration that occurs in a given time period and is very important for ensuring accurate measurement, as peak accelerations that exceed the design range of the accelerometers may result in false readings or even damage to the accelerometers. RMS is the average vibration level and is important in understanding the cumulative effect of ongoing vibration and therefore the risk of damage to the Yankee and other equipment. RMS is calculated by squaring the signal to make all values positive, taking the arithmetic mean of the squared values, and then taking the square root of the result:
 where a is acceleration, for a set of n data points.
 Figure 4 – Peak and RMS of a typical vibration signal
Frequency is measured in Hertz (Hz), where 1 Hz = 1 cycle per second. Real-world vibration signals are a complex mixture of different frequencies, due to harmonics from the blade and the impact of additional sources of vibration around the machine. Harmonics at the blade occur because of the different ways in which a blade can bend, as shown in Figure 5.
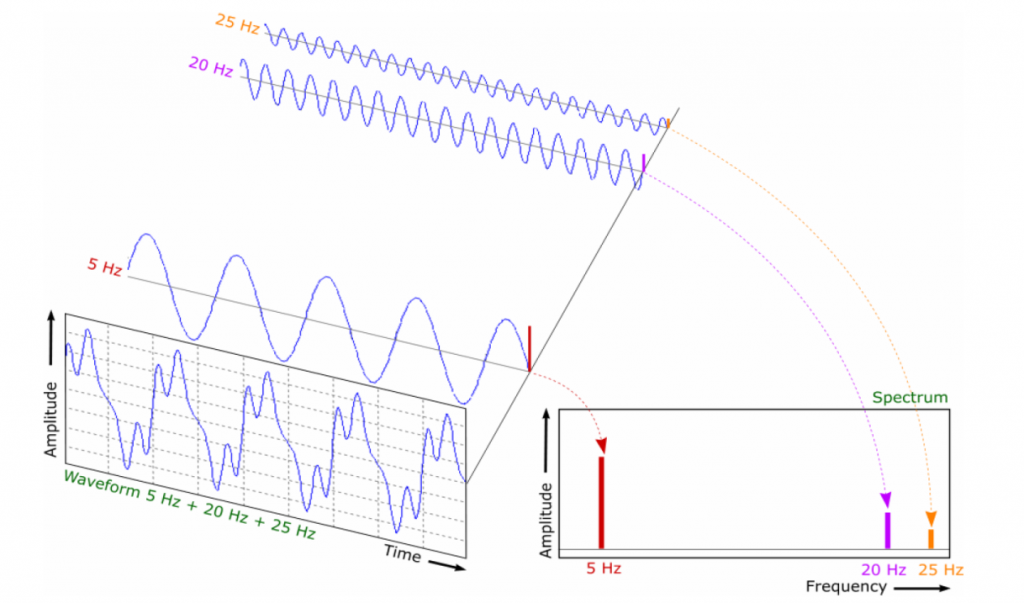
To make sense of the mixture of frequencies, the data is commonly visualized using a Fast Fourier Transform (FFT). This is a mathematical algorithm which decomposes the raw signal into a spectrum of component frequencies, plotted against the amplitude of each frequency, as illustrated in Figure 6. This helps to identify particular resonances or driving frequencies related to different processes on the machine – for example, motors and gearboxes tend to produce low frequencies (<1000 Hz) while, on the other hand, friction effects from the creping blade tend to produce higher frequencies (up to 20000 Hz) [6].
 Figure 6 – Fast Fourier Transform
To display the FFT over a period of time (historical data), a 2D array can be used as shown in Figure 7. In this figure, colour represents the amplitude, with frequency across the horizontal axis and time on the vertical axis with later values at the bottom. The example shows a blade change producing a drop in amplitude across most of the frequency spectrum.
 Figure 7 – FFT History Array (BTG VigilancePRO™)
Analysis and Software for vibration control
The key to successfully controlling vibration is the ability to relate the vibration back to events and conditions on the machine, so that problems can be traced back to the root causes and corrective actions can then be evaluated. For day-to-day management of vibration, the key control levers are blade changes, Yankee coating chemicals, and machine speed. Deeper root causes include a wide range of factors such as raw materials (furnish), mechanical issues on the machine, and process conditions like wet-end pH. A good vibration monitoring system provides analysis to assist in both the day-to-day management of blade life and Yankee coating, and also longer-term management of factors such as seasonal variation in furnish quality.
Typical day-to-day vibration control strategies rely on changing the blade or increasing the Yankee coating add-on rates when vibration becomes high. In its simplest implementation, this is done by setting a maximum threshold for vibration and taking corrective action whenever vibration levels approach the threshold. Problems are therefore usually detected at the end of the blade life, when vibration is naturally closest to the threshold. However, the effectiveness of this strategy can be improved by monitoring a broader range of abnormal vibration characteristics, not just high vibration.
BTG has found that by benchmarking the whole vibration development curve, it is possible to identify abnormal vibration at any stage in the blade life. Problems are then detected earlier than with a fixed threshold, giving operators more time to respond and potentially achieving lower average vibration levels. This particularly improves the effectiveness of on-the-run corrective actions like coating adjustments which may have a slower effect on vibration but can be carried out without breaking the sheet (in contrast to blade changes). This type of analysis can be automated in the software if the blade changes are recorded digitally in the data system. As an example, BTG VigilancePRO software integrates the blade vibration level over time and uses the blade change data to automatically overlay a trend for the current blade onto the previous two blades for comparison (Figure 8). The bright section of line at the bottom left in the figure is the current blade at around 8 hrs blade life, while the dimmer lines behind indicate the previous two blades. A slight difference between the previous two blades is clearly shown, and any sudden change in performance with the current blade will be seen immediately.
 Figure 8 – Automated blade-by-blade comparison (BTG VigilancePRO™)
The strategy described above is very effective at controlling vibration in the short term, but in the long term consumption of blades and/or chemicals tends to drift upward, with an associated increase in costs. With an effective day-to-day control strategy in place, a developing problem with the Yankee coating or process will not actually cause an increase in average vibration level, but instead an increase in blade and chemical costs as operators work harder to keep the vibration under control.
To manage vibration in a cost-effective way, it is necessary to monitor blade and chemical consumption over time in addition to vibration levels. This captures the wider impact of any problems and assists in making decisions on when to take more extensive actions such as off-machine servicing of the blade holders or upgrading wet-end systems to address the root causes of vibration. Chemical consumption is commonly trended in the DCS, so good data is readily available, but it is important to relate this information back to the vibration levels, a step that is often overlooked. Blade life tracking is more difficult because it has traditionally relied on the operators manually recording blade changes in shift logs, but digital solutions are now available to capture this information more easily. Ideally, all three sources of information – blades changes, chemical use and vibration levels – should be captured electronically and integrated into a single system to be analysed and displayed together (Figure 9).
 Figure 9 – Integrated view of blade change and chemical data alongside vibration (BTG Vigilance PRO)
In summary, to simplify the root cause analysis of blade vibration problems, a Vibration Monitoring System (VMS) should provide analysis of blade and chemical consumption as well as vibration, and should provide a simple blade-to-blade comparison of the vibration development curve. This provides an overview of vibration that can be easily used and understood by anyone from machine operators to mill managers, thus leaving technical experts free to focus on other priorities.
Conclusions
Vibration monitoring at the creping blade is now a widespread industry practice to manage the risk of chatter and maximise the time between Yankee grinds. Off-the-shelf vibration monitoring systems are readily available, and hardware components are very standardized, but key differences remain in the software interface and the level of automated analysis that the system presents.
Proactive management of vibration necessitates tracking other data such as blade life and Yankee coating chemical consumption, in addition to vibration measurements. This data should all be integrated into the vibration monitoring system to provide a single-point overview of the chatter risk. Advanced analysis methods that benchmark the vibration curve over the complete blade life and distinguish between paper grades on the machine allow problems to be detected earlier and provide a greater level of protection than traditional methods that sought simply to cap the vibration at a fixed threshold. With modern, automated VMS systems, machine operators and mill management now have new tools that give them greater understanding and ability to correct vibration problems without having to rely on the mill’s technical experts.
To learn more about how vibration monitoring can protect your machine, please send your questions to info@btg.com with “Tissue Solutions Team” in the subject line.
REFERENCES
[1] M. K. Ramasubramanian, Z. Sun and G. Chen, “A Mechanics of Materials Model for the Creping Process,” J. Manuf. Sci. Eng., vol. 133, no. 5, 2011.
[2] S. Archer, V. Grigoriev, G. Furman, L. Bonday and W. Su, “Chatter and Soft Tissue Production: Process Driven Mechanisms,” in Tissue World Americas Conference, Miami, Florida, 2008.
[3] M. Paczkowski, “Material interactions and the effect of doctor blades on Yankee surface,” in Tissue World 2009 Conference, Nice, 2009.
[4] P. Hämäläinen, N. Hallbäck and C. Barbier, “Development and evaluation of a high-speed creping,” Nordic Pulp & Paper Research Journal, vol. 31, no. 3, 2016.
[5] I. Padley and J. Devillers, “Fines management for tissue machines,” Paper Technology, 2014.
[6] X. Escaler, O. de la Torre and E. Egusquiza, “Analysis of chatter marks damage on the Yankee dryer surface of a tissue machine,” Engineering Failure Analysis 23, pp. 44-54, 2012.


Comments are closed.