The rise of big data, meaning the collection and storage of exponentially greater quantities of information, is having positive impacts on tissue making. Dramatically better methods for generating, storing, analyzing and understanding data are giving progressive tissue-producing companies opportunities to gain important advantages. This can result in smoother operation with fewer process upsets, for lower raw material consumption and better bottom-line profitability.
In this article, we will review the ways in which data has been used in tissue making in the past, and at what the current practices are today for many companies. We will then look at other advanced data management methods that are not as widely used today but can offer competitive advantages. Finally, we will speculate on where big data management might be going in the future.
By Jay Sheldorf, with contributions from Mark Korby, Capstone Technologies Inc, BTG Group
Table of Contents
1. Definitions
2. Past Methods
3. Current Practices
4. Basic Applications
Graphical Analysis
Cost-Based Operating
Centerlining
5. Advanced Applications
Troubleshooting
Statistical Analysis
Statistical Modeling
Soft Sensors
6. The Future
1. Definitions –
Data is generated when a process is measured and quantified. In tissue production, the primary goal is to create a sheet with the target characteristics or properties set by the customer. In order to know if those targets are met, measurements must be taken and data recorded. When targets are met, it is most important to know what process conditions led to that success, i.e. what “recipe” or “formula” was successful? Again, it is data, process data in this case, that supplies the answer.
To create a successful business based on tissue production, tissue makers must always be innovating and looking for less costly, slightly different recipes or manufacturing techniques that produce the same or even an improved product. Clearly, process and product improvement efforts require a structured approach to the management of production data.
The management of process data can be broken down into three activities:
- Data acquisition – The generation of data by a sensor or a laboratory technician
- Data storage – The archiving of data in some form for future use
- Data analysis – The recovery and use of past data to make decisions regarding future actions
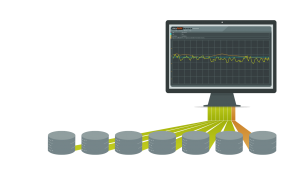
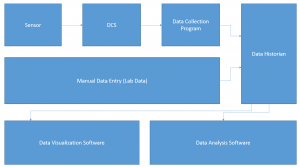 Figure 1: Management of process data
With the understanding that data management is really the only method for evaluating past machine performance and providing a direction for future improvement, let’s look at how data has been managed in the past, the current state of the art, and how data might be handled in the future.
2. Past Methods –
For the roughly 150 years that tissue has been manufactured, data management was limited and rudimentary by modern standards. Product properties and major process settings were visually acquired and data storage involved placing those values onto written log sheets. While this data “management” technique was necessary and adequate, it suffered from a number of drawbacks.
On the acquisition side, because all data was transcribed from visual indicators onto a written log, human error was always possible, whether reading or recording data. Also, taking process readings was time and labor intensive, so it was performed relatively infrequently, with a “high frequency” being perhaps once an hour. Any process upset or oscillation which occurred within that time period would most likely remain undetected.
The paper-based log system presented even greater challenges when it came to the retrieval and analysis portion of data management. Even answering a very basic question, such as “What was the vacuum on that suction roll last time we ran grade X?” required manually going through all the logs to determine when grade X was run and then hand transferring and averaging enough readings to make a meaningful conclusion.
More sophisticated inquires like, “On heavy weight grades, does the steam box steam flow or suction roll vacuum have a greater impact on dryness after pressing?” posed a greater challenge. Again the log sheets had to be filtered through by hand to determine when the grades in question were run, and then the data for the three variables in question needed to be copied and consolidated in one place.
Once the condensed data was available, techniques such as graphing and statistical analysis could be applied. The difficulty involved in performing these types of studies meant that they were often not done due to time and manpower constraints. Instead of solid analysis, decisions were frequently made based on intuition and limited sets of data.
In terms of functionality, paper-based data management reliably allowed operations personnel to capture snapshots of good conditions in the past so that they could attempt to reproduce them in the future. Depending on the human resources available, log sheets also supported simple troubleshooting and process improvement efforts.
3. Current Practices –
Just as many other aspects of life have been rapidly changed by computers, the world of process data management shifted dramatically as data became digital. The transition started with the introduction of single-loop, microprocessor based controllers. Once process data existed as electronic digital values, it made sense to connect those controllers together so that multiple values could be displayed and manipulated from a single screen.
As the cost of digital storage media dropped, it was a “no-brainer” to record all incoming data and create an automatic electronic log, or database, of process values. There have been many different hardware and software platforms used to accomplish this. Each of the control system vendors have promoted their own control systems and associated process data archives, but as other parts of the mill (other process areas, accounting, and warehouses) became digitized, users wanted to be able to combine information from multiple systems and areas. For this reason, some of the best data historian and analysis software packages were developed by third party vendors who were outside of the control system arena.
The current state-of-the-art data historian collects data in a streamlined and efficient time-series data structure. It is optimized to store thousands of data points per second, with sub-second time resolution, and is able to retain it for multiple years, or even forever. Built-in standard interfaces, data security, data compression and interpolation for fast response times, and data correlation with events like grade changes, trials, shifts/crews, web breaks, etc., are features often found in modern data historians. Overlying the data historian is the human interface to all this data, a software package typically consisting of data monitoring, alarming, analytics, and advanced data visualization components.
Machine operators and engineers have access to high frequency data (second or sub-second readings) from all instrumented sensors on the machine, the lab test data, and key production events. With a system like this, the challenge is not: “How do I pull together the data I need to do an analysis?”, but rather “How do I find and learn to use the software that will allow me to manipulate, analyze, and get the most understanding out of all of the data that is in the database?” The key aim is, therefore, to get usable insight and understanding out of the big data input.
4. Basic Applications – Already widely used
The combination of a complete electronic database and the computing power to manipulate it provides a massive leap forward in the ability to manage and interpret data. Improved data management equates to improved machine operation. Here are a few examples of the opportunities made available by contemporary data management systems.
Graphical Analysis
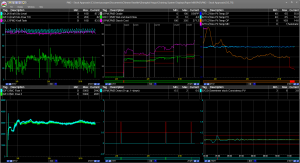
The most basic form of process understanding and improvement starts with simply being able to present real time data to operators and engineers. In the previous paper-based world, if a variable was drifting away from a target, and only being observed as a written number every hour or every other hour, it might have taken several observations or several hours before a problem was detected and perhaps even longer before an action was taken to correct it. Today, if that same variable is shown as a trend line updated every minute or second, the drift away from a target value can be noticed sooner and corrected in a much more timely manner.
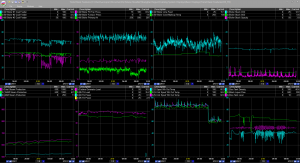 Figure3: Multi-trend Graphical Analysis
Cost-based operating
A good data management system should have access to values beyond those from a single process area. One approach to improving machine operations is to take cost data and integrate it with process data to create meaningful, dollar-based targets. Displaying a pseudo-variable of lost dollars or euros per hour determined by the difference between a grade-based target and an actual steam flow is more useful and meaningful to an operator than simply saying: “Try to keep the flow under X kilograms/hr”.
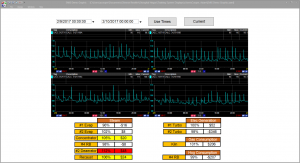 Figure 4: Cost-based Operating
Centerlining
Many facilities depend on grade-based centerlines to successfully produce a range of products. Modern data management supports this effort in two ways: 1. By enabling the display of centerline limits on a per variable and per grade basis. And 2. By having access to large quantities of historical data, it is relatively easy to apply statistical methods to the process data to create meaningful and achievable limits.
Advanced Applications – How Data can be Used Better
Computers and large databases make operational decisions easier, faster, and more efficient. They also make it possible to do wide ranging investigations that were previously virtually impossible. Being able to compile a large number of process variables over a long period of time permits engineers and operators to carry out both effective troubleshooting and valuable process optimization.
Troubleshooting – Helps you eliminate possible causes
Consider a case where a quality parameter such as MD strength drifts out of spec over the course of producing a couple of reels. Due to the gradual deterioration of the parameter, it might be difficult to detect a corresponding change in an upstream variable, even if real-time trends are available. Using the computer to compress the displayed time scale, and make the gradual deterioration more visually prominent, might also bring to light a corresponding change in another upstream variable that is related to strength.
But what if nothing is indicated by this time compression exercise? Assuming all of the pertinent process variables are being logged in the system and displayed, the lack of an upstream process change still gives you valuable information. A large group of potential problems has been eliminated.
The next step in the troubleshooting process is to look at changes that aren’t shown in the trends. Perhaps someone connected the wrong tote to a chemical metering pump. Whatever the outside influence is determined to be, the elimination of all the online machine-related variables as suspects vastly speeds up the troubleshooting process.
Statistical Analysis – Proactive approach for best economy
Although rapid problem detection and correction is valuable, an even more exciting application of a modern data management system is to use it proactively and find ways to improve the economic performance of a process or machine. No matter how hard we try to hit centerlines and targets, there is always some fluctuation in process variables, leading to a range of outcomes in product qualities.
Fortunately, there are statistical software packages available which can analyze large amounts of interrelated data and determine the most significant relationships. Consider again the quality parameter of MD strength. Although a mill might believe that their best “handle” to optimize MD strength may be an expensive wet-end additive, statistical analysis of past data might instead indicate that an operational variable such as refining intensity can have almost the same level of control, with considerably less cost.
Statistical Modeling – Correlation to “standard” variables
The next step in the progression of sophistication of data management applications is the real time use of statistical multivariate analysis, meaning – a collection of different techniques used for analyzing relationships among multiple variables at the same time.
There are situations when a significant process variable, which is either very expensive or impossible to measure in real time (such as a lab-based quality test), can be correlated with a high level of confidence to a set of “standard” process variables (i.e. online pressure, temperature, flow, speed) which are already monitored. A multivariate analysis of historical data can yield a mathematical model which describes the influence of each of the measured variables on the output variable.
The model can then be run in real time, using constantly updated process variables, to calculate the virtual output variable. In some circles this type of model is called a “soft sensor.” This technology is well enough established that the US EPA (Environmental Protection Agency) is willing to accept modeled soft sensor results for some effluent values, once experimental data has verified the model.
Soft Sensors – Provide verifiable economic payback from improved data management
While some of the benefits of a good data management system are intuitively evident, they can often be hard to economically quantify. The use of soft sensors, therefore, presents an opportunity to show the tangible economic returns. On a tissue machine, the ability to observe a virtual quality parameter drifting off-spec in mid-reel can perhaps mean that only a single reel needs to be culled, instead of several of them, assuming the problem is rapidly rectified. The delay incurred by the traditional method of completing the reel, taking a sample, and getting results back from lab, and the accompanying production of additional off-spec product while this occurs, is avoided by the use of a soft sensor. Based on this kind of use of a soft sensor, the economic savings coming from reduced waste and increased productivity is easily documented.
There are also obvious savings if a piece of software can replace the infrastructure of a remote testing location. Mill examples might include a testing shack located at a treatment pond outfall, or a testing platform halfway up a smokestack, both of which must support a group of hardware-based sensors requiring periodic maintenance and replacement.
In other situations, soft sensors may be run in parallel with a physical “hard sensor” to validate or cross-check instrumentation; some recent applications include headbox consistency soft sensors on a tissue machine. Soft sensors have also been used to predicate properties such as jumbo reel basis weight, and are used to validate lab jumbo reel basis weight test results, or in some cases reduce the number and frequency of lab tests performed. Future applications may potentially include prediction of tensile strength, bulk or even handfeel properties in the finished reel, based upon modelling of upstream process data.
The Future – Even greater insight, over wider areas, will be possible
Projecting future developments always involves an element of guesswork. It seems safe to speculate that the future of data management in the tissue industry will parallel the growth of computing power and the application trends seen in other industries. The amount and breadth of data collected will no doubt increase. The use of models for data interpretation will grow as well and become more commonplace. Improvements in sensor technology will improve the quality and maybe even the types of data which come from the machine and the product.
Computers and software will allow us to work with datasets which extend over larger areas of the manufacturing process. A tissue machine will be considered as part of a whole process rather than a world of its own. Looking at developments such as autonomous cars, it is reasonable to expect that computers will become a larger part of the decision making and planning process. Artificial intelligence can help find meaningful patterns in large sets of data. This could lead to such things as improved preventative maintenance, where potential failures are detected not by a single measurement, but by a group of subtle deviations which can now be analyzed in their entirety.
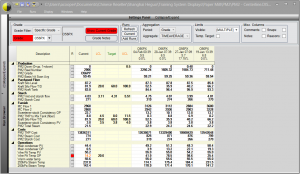 Figure 6: Image of Possible Future Practices
If in addition to process and cost data, an intelligent scheduling program has information about future orders and existing pulp inventories, plus downstream warehouse capacity and shipping capabilities, that expert system could optimize the production scheduling through a tissue machine, or even through multiple machines.
Preventive maintenance and scheduling optimization are not new ideas, and are currently being applied to some degree in many organizations. However, the use of advanced data management and expert systems will automate the decision-making process and lead to further increases in the overall efficiency of the tissue manufacturing process.
Summary –
Dramatically better methods for generating, storing, analyzing and understanding data are giving progressive tissue-producing companies important competitive advantages. Tissue making and converting process conditions that for decades and even centuries have been somewhat mysterious and difficult to understand, are today being managed with much better precision, accuracy and reproducibility thanks to better data management. This can help with both reactive troubleshooting, as well as proactive statistical analysis and monitoring, to give smoother operations with fewer process upsets, resulting is higher productivity in which quality specifications are achieved with lower quantities of expensive raw material inputs. This is good both for bottom-line profitability, as well as environmental and sustainability targets.


Comments are closed.